Consolidate your data into one visual space so you can identify trends, gain insights, and share with clarity.


120,472
Trusted Reviews
99%
Customer Satısfaction
92K
Expenses Saved

From high-level summaries to granular detail, choose the visualization that best displays your data.

Trend & comparison views
Side-by-side and period-over-period views for spotting change quickly.

Charts & graphs
Bar, line, and comparison charts for tracking trends and performance over time.

Tables
Granular, ranked data views for when you need the detail behind the headline number.

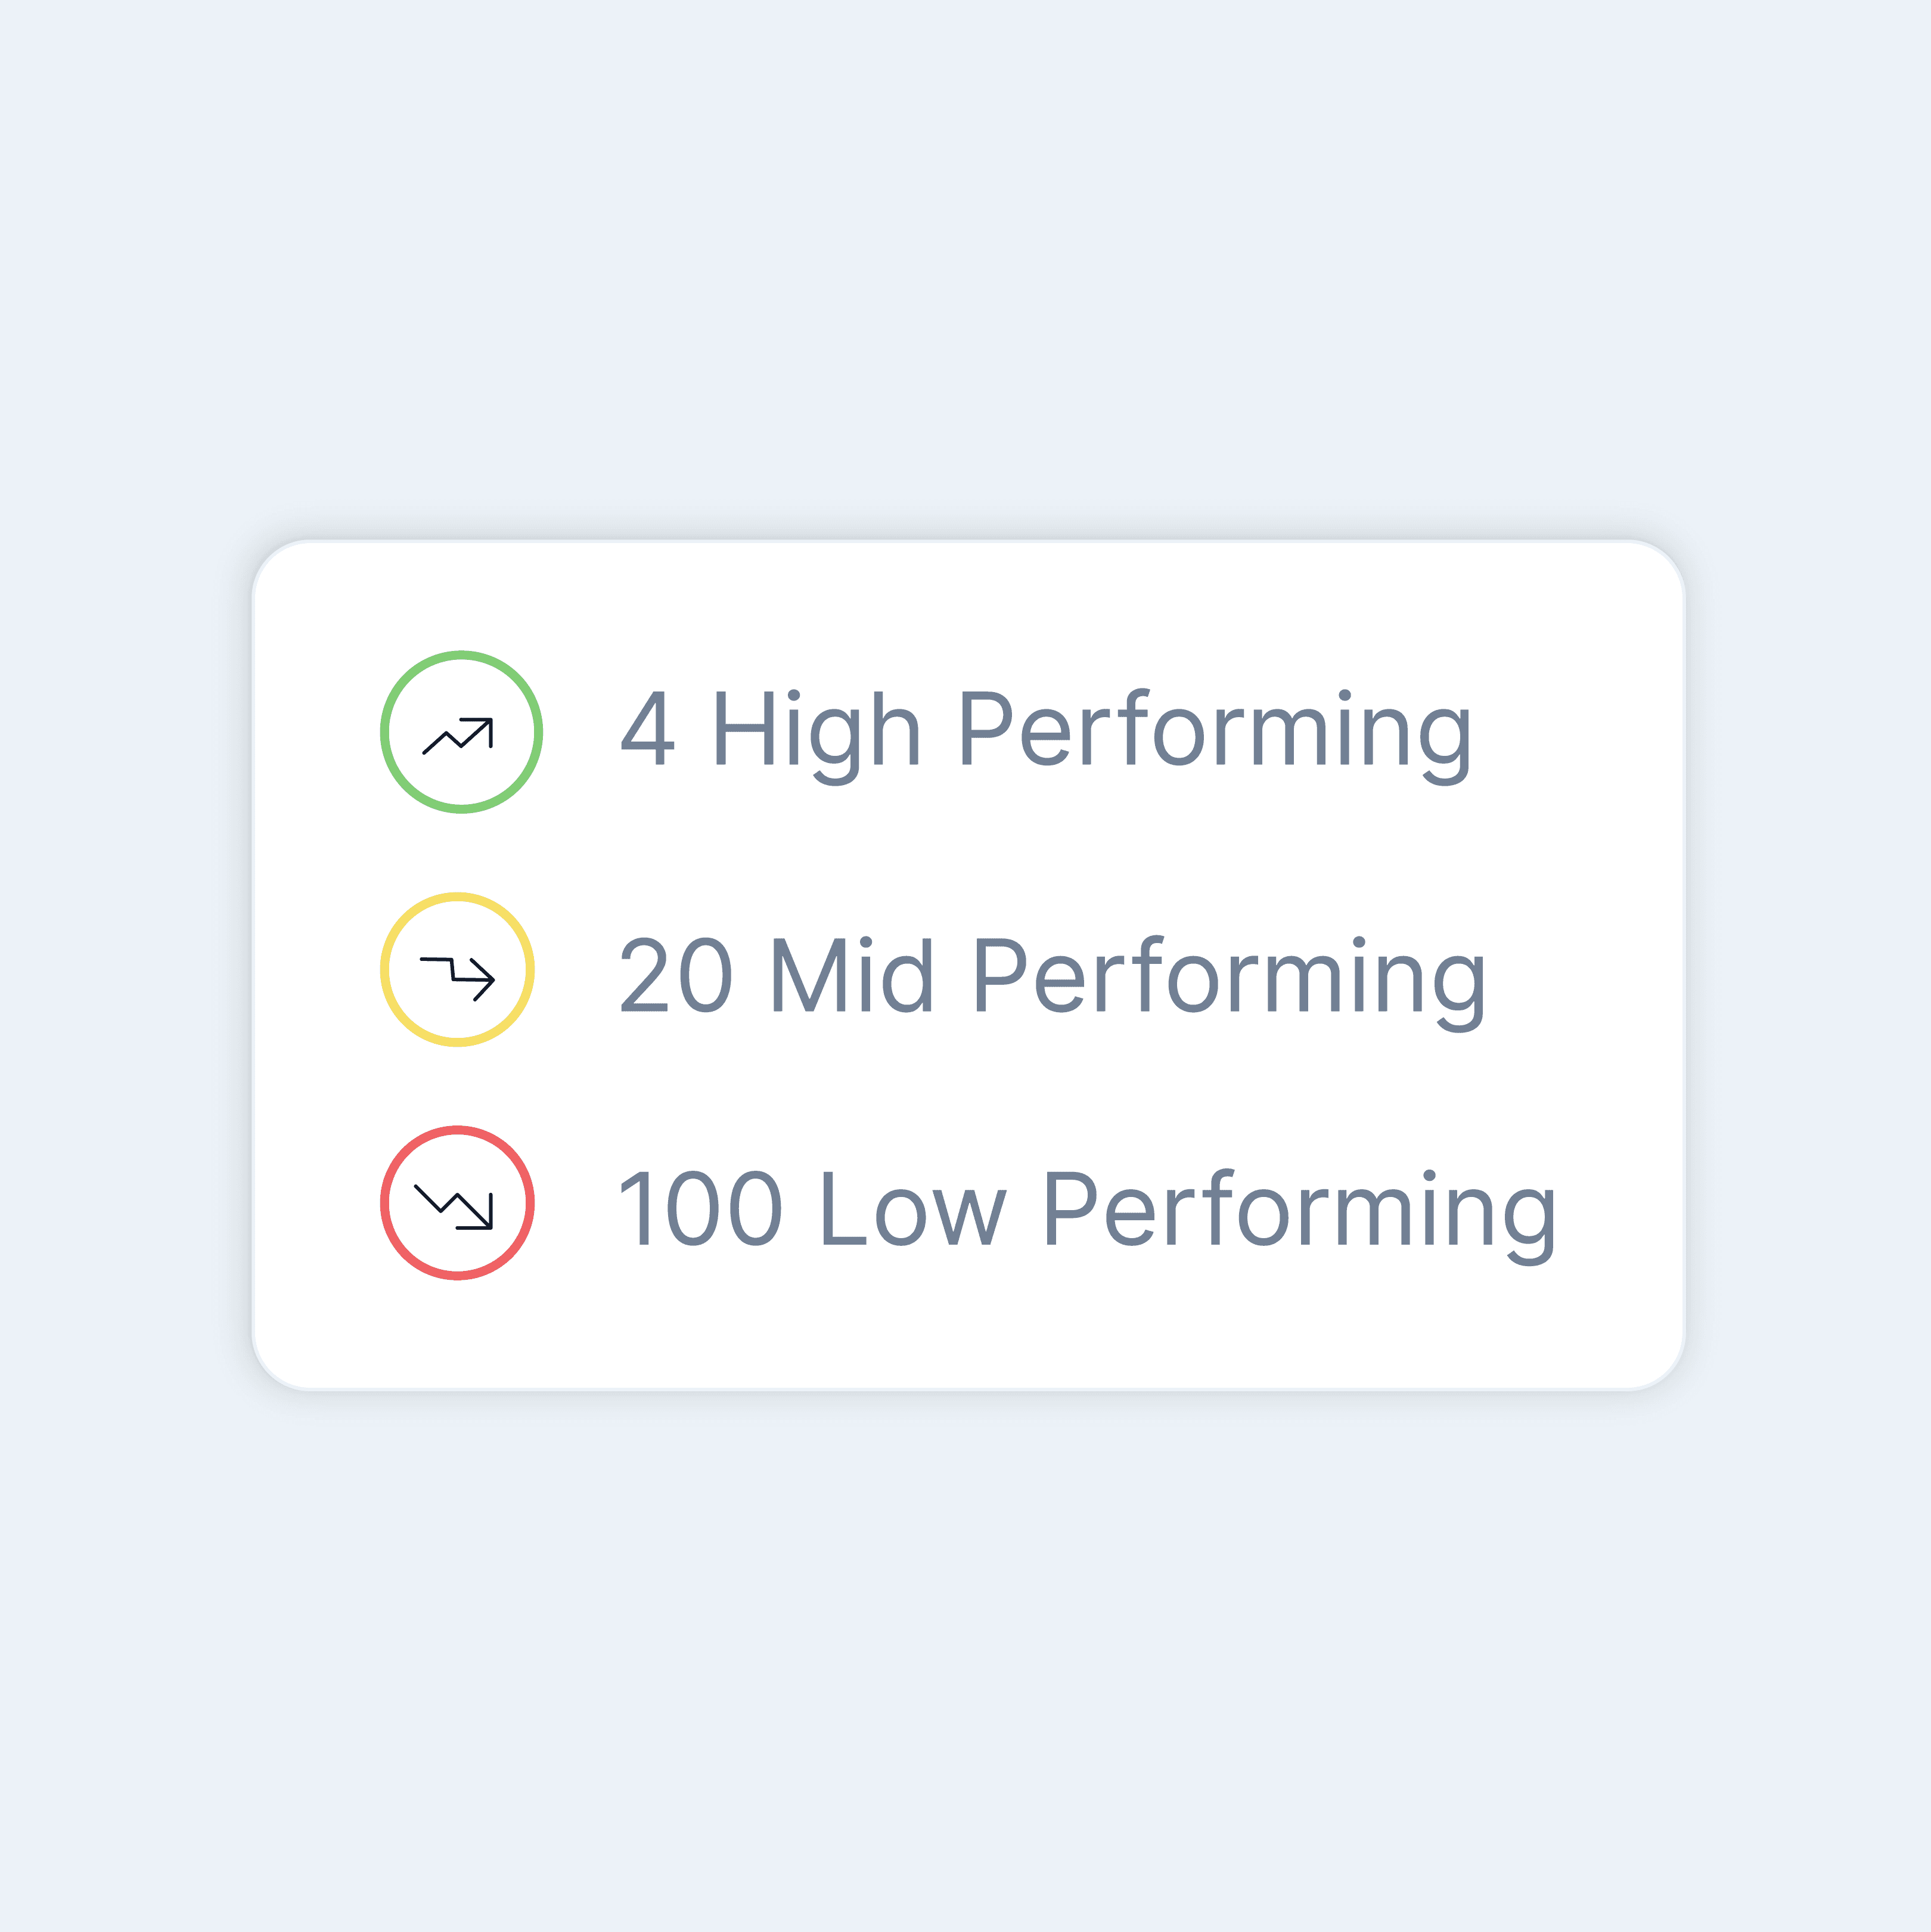
Dynamic Benchmarks
At-a-glance scores for the metrics that matter most, with clear pass/fail visual cues.

No code, no formulas, just the view your team needs.

Customized and designed by you
Hurree enables you to build dashboards that display your data exactly how you want to see it.
Sections
Section off key pieces of information for better organisation and a clean, clutter-free view of your metrics, making quick analysis a breeze.
White labelling
Customize your account so that your shareable reports align with your brand colours and logo.
Riva AI insights
Riva continuously scans your dashboards and surfaces smart suggestions, trends, and anomalies worth acting on.
Annotations and comments
Add context directly onto your dashboards, so anyone viewing them understands the story behind the numbers, not just the numbers themselves.
Prebuilt templates
Save time and effort by building your first dashboard in minutes using a ready-made template.
Customer Case Studies

Blake Mark Productions
How Blake Mark Productions uses
Hurree to turn five-hour reports into a
single client link.

Visit Belfast
How Visit Belfast uses Hurree to turn scattered data into confident, real-time decisions

Wavey Ice
How Wavey Ice uses Hurree to streamline scattered data and gain greater company-wide visibility
80+ Connectors


Bring your data together fast with prebuilt integrations that work straight out of the box.
FAQ's
What is Hurree?
What types of visualizations can I create in Hurree?
Can I customize dashboards to match my brand?
Do I need technical or coding skills to build a dashboard?
Does Hurree update my data in real time?
Can Riva AI help me understand my dashboards?
Can I share dashboards with my team or clients?
Is my data secure in Hurree?




